суббота, 25 мая 2013 г.

Tweets mining using NLP can help in goods marketing.

   Recently the topic of data mining of messages in social networks, particularly in Twitter, has been widely discussed, from the point of view of sociology, politics, economics, marketing, etc.

  In this study, I want to show that tweets mining  can be valuable for the marketing research of goods. I took smartphones as an example. I have downloaded several thousands of tweets that refer to smartphones and contain the keywords like: iPhone, Apple, Galaxy, Blackberry, etc.  To study the iPhone concept, we used the theory of frequent sets and association rules. The research was conducted using the language of statistical calculations R.
Here are the results obtained:

 We received a matrix for aggregated association rules for concept 'iphone':


The association rules for concept 'iphone' with high support can be represented with the help of such graphs:


The frequent sets for concept 'iphone' with the high value of support can be represented by the following graphs:


Here is an example of associations for different smartphones :


The popularity of different models:

The comparison of two models based on tweets mining, using syntactic parsing:


воскресенье, 19 мая 2013 г.

About Eurovision 2013 forecasting using NLP: the day after


Previous part.

Yesterday the final of Eurovision Song Contest took place.
Before the final, I made a forecasting on the basis of data mining of tweets.
The results of my analysis were the following:
winner is going to be a singer from Denmark, the next three places will go to Ukraine, Russia and Ireland.
The anounced results of the final are:
1st place - Denmark, 2nd place - Azerbaijan, 3rd place - Ukraine, 4th place - Norway, 5th place - Russia.
 Our  data mining analysis has correctly detected the winner and  the top places for Ukraine and
Russia. However, Ireland was mistakenly included into top five,  and Azerbaijan and Norway were not mentioned at all.
I have conductd analysis again and found a basic mistake in the algorithm. In the analysis, a great number of associative rules appears and they must be filtered out. For the filtration, I chose the words of high frequency, which included "Ireland" and ignored "Azerbaijan" and "Norway". That is why the tweets with those words were excluded from the analysis. The mistake is in the fact that high-frequency keywords may be used in some other contexts and have nothing to do with the analysis with the favourites of the competition. I have conducted the analysis once again, it was on the basis of the same tweets which were loaded in May 17. All countries participating in the contest were taken into account. And this forecasting turned out to be very close to the real results of Eurovision Song Contest.


Besides, it is worth saying that Twitter is not evenly widespread in all countries, that is why the number of tweets from different countries was also different. Additionally, there is also an unpleasant political factor. E.g., Ukraine is in the top 3 due to the results, but Russia (Ukraine's neighbour) gave it only one point.
 
The results presented are for the same source of tweets, obtained with the consideration of previous errors:
 
 lhs              rhs          support confidence       lift
1  {denmark,                                                 
    norway}      => {win}    0.014610390  0.9000000  1.3137441
2  {denmark,                                                 
    favourites}  => {win}    0.011363636  1.0000000  1.4597156
3  {azerbaijan,                                              
    norway}      => {win}    0.011363636  0.8750000  1.2772512
4  {denmark,                                                 
    ukraine}     => {win}    0.008116883  0.8333333  1.2164297
5  {azerbaijan,                                              
    russia}      => {win}    0.008116883  0.8333333  1.2164297
6  {azerbaijan,                                              
    denmark}     => {win}    0.008116883  0.7142857  1.0426540
7  {finland,                                                 
    sweden}      => {win}    0.008116883  1.0000000  1.4597156
8  {russia,                                                  
    ukraine}     => {win}    0.006493506  0.8000000  1.1677725
9  {azerbaijan,                                              
    ukraine}     => {win}    0.006493506  0.8000000  1.1677725
10 {norway,                                                  
    ukraine}     => {win}    0.006493506  0.8000000  1.1677725
11 {norway,                                                  
    russia}      => {win}    0.006493506  0.8000000  1.1677725
12 {denmark,                                                 
    russia}      => {win}    0.006493506  0.8000000  1.1677725
13 {denmark,                                                 
    sweden}      => {win}    0.006493506  0.8000000  1.1677725
14 {azerbaijan,                                              
    russia,                                                  
    ukraine}     => {win}    0.006493506  0.8000000  1.1677725
15 {norway,                                                  
    russia,                                                  
    ukraine}     => {win}    0.006493506  0.8000000  1.1677725
16 {denmark,                                                 
    russia,                                                  
    ukraine}     => {win}    0.006493506  0.8000000  1.1677725
17 {azerbaijan,                                              
    norway,                                                  
    ukraine}     => {win}    0.006493506  0.8000000  1.1677725
18 {azerbaijan,                                              
    denmark,                                                 
    ukraine}     => {win}    0.006493506  0.8000000  1.1677725
19 {denmark,                                                 
    norway,                                                  
    ukraine}     => {win}    0.006493506  0.8000000  1.1677725
20 {azerbaijan,                                              
    norway,                                                  
    russia}      => {win}    0.006493506  0.8000000  1.1677725
21 {azerbaijan,                                              
    denmark,                                                 
    russia}      => {win}    0.006493506  0.8000000  1.1677725
22 {denmark,                                                 
    norway,                                                  
    russia}      => {win}    0.006493506  0.8000000  1.1677725
23 {azerbaijan,                                              
    denmark,                                                 
    norway}      => {win}    0.006493506  0.8000000  1.1677725
24 {azerbaijan,                                              
    norway,                                                  
    russia,                                                  
    ukraine}     => {win}    0.006493506  0.8000000  1.1677725
25 {azerbaijan,                                              
    denmark,                                                 
    russia,                                                  
    ukraine}     => {win}    0.006493506  0.8000000  1.1677725
26 {denmark,                                                 
    norway,                                                  
    russia,                                                  
    ukraine}     => {win}    0.006493506  0.8000000  1.1677725
27 {azerbaijan,                                              
    denmark,                                                 
    norway,                                                  
    ukraine}     => {win}    0.006493506  0.8000000  1.1677725
28 {azerbaijan,                                              
    denmark,                                                 
    norway,                                                  
    russia}      => {win}    0.006493506  0.8000000  1.1677725
29 {azerbaijan,                                              
    denmark,                                                 
    norway,                                                  
    russia,                                                  
    ukraine}     => {win}    0.006493506  0.8000000  1.1677725
30 {azerbaijan,                                              
    georgia}     => {win}    0.004870130  1.0000000  1.4597156
31 {georgia,                                                 
    norway}      => {win}    0.004870130  1.0000000  1.4597156
32 {favourites,                                              
    norway}      => {win}    0.004870130  1.0000000  1.4597156
 

суббота, 18 мая 2013 г.

Eurovision 2013 forecasting using NLP and association rules

About Eurovision 2013 forecasting using NLP: the day after

Today, on the 18th of May, in Sweden, the Eurovision Song Contest 2013 will be held. I tried to make a forecasting of the winners, on the basis of Twitter messages, using natural language processing (NLP),  a theory of association rules and semantic fields.  I downloaded the tweets with the keywords (eurovision) just for one day - May 17. The analysis conducted shows that the winner is going to be a singer from Denmark, the next three places will go to Ukraine, Russia and Ireland. Well, we'll see :)
 If my forecasting is correct, I will write the algorithms of my analysis in detail.

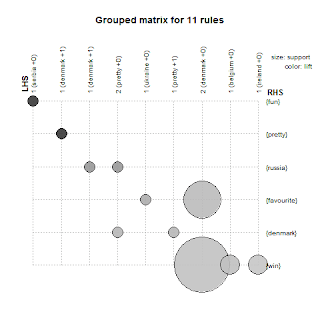
Here are some of obtained association rules and their presentations :
lhs          rhs          support confidence     lift
1 {denmark,                                           
   russia,                                            
   ukraine} => {win}    0.009779951        0.8 1.216357
2 {ireland,                                           
   russia,                                            
   ukraine} => {winner} 0.002444988        1.0 2.655844
3 {denmark,                                           
   ireland,                                           
   ukraine} => {winner} 0.002444988        1.0 2.655844
4 {denmark,                                           
   ireland,                                           
   russia}  => {winner} 0.002444988        1.0 2.655844
5 {denmark,                                           
   ireland,                                           
   russia,                                            
   ukraine} => {winner} 0.002444988        1.0 2.655844

   lhs              rhs          support confidence     lift
1  {denmark,                                               
    favourites}  => {win}    0.017114914  1.0000000 1.520446
2  {denmark,                                               
    ukraine}     => {win}    0.012224939  0.8333333 1.267038
3  {russia,                                                
    ukraine}     => {win}    0.009779951  0.8000000 1.216357
4  {denmark,                                               
    russia}      => {win}    0.009779951  0.8000000 1.216357
5  {denmark,                                               
    russia,                                                
    ukraine}     => {win}    0.009779951  0.8000000 1.216357
6  {holland,                                               
    netherlands} => {win}    0.004889976  1.0000000 1.520446
7  {denmark,                                               
    ireland}     => {win}    0.004889976  0.6666667 1.013631
8  {lithuania,                                             
    moldova}     => {win}    0.002444988  1.0000000 1.520446
9  {ireland,                                               
    ukraine}     => {winner} 0.002444988  1.0000000 2.655844
10 {ireland,                                               
    russia}      => {winner} 0.002444988  1.0000000 2.655844
11 {ireland,                                               
    russia,                                                
    ukraine}     => {winner} 0.002444988  1.0000000 2.655844
12 {denmark,                                               
    ireland,                                               
    ukraine}     => {winner} 0.002444988  1.0000000 2.655844
13 {denmark,                                               
    ireland,                                               
    russia}      => {winner} 0.002444988  1.0000000 2.655844
14 {denmark,                                               
    ireland,                                               
    russia,                                                
    ukraine}     => {winner} 0.002444988  1.0000000 2.655844
1  {netherlands} => {vote}        0.06060606        0.8  2.200000
2  {russia}      => {love}        0.04545455        1.0  3.300000
3  {denmark}     => {win}         0.04545455        0.5  1.375000
4  {moldova}     => {votes}       0.03030303        1.0 16.500000
5  {irish}       => {votes}       0.01515152        1.0 16.500000
6  {holland}     => {netherlands} 0.01515152        1.0 13.200000
7  {holland}     => {win}         0.01515152        1.0  2.750000
8  {belgium}     => {love}        0.01515152        0.5  1.650000
9  {belgium}     => {win}         0.01515152        0.5  1.375000
10 {holland,                                                    
    netherlands} => {win}         0.01515152        1.0  2.750000
11 {denmark,                                                    
    ukraine}     => {favourite}   0.01515152        1.0  7.333333
lhs          rhs         support confidence      lift
1  {denmark} => {win}          0.24  0.8571429  1.785714
2  {denmark} => {favourite}    0.16  0.5714286  2.857143
3  {belgium} => {win}          0.08  1.0000000  2.083333
4  {ireland} => {win}          0.08  0.5000000  1.041667
5  {ukraine} => {favourite}    0.04  1.0000000  5.000000
6  {serbia}  => {fun}          0.04  1.0000000 25.000000
7  {pretty}  => {russia}       0.04  1.0000000  8.333333
8  {pretty}  => {denmark}      0.04  1.0000000  3.571429
9  {pretty,                                            
    russia}  => {denmark}      0.04  1.0000000  3.571429
10 {denmark,                                           
    pretty}  => {russia}       0.04  1.0000000  8.333333
11 {denmark,                                           
    russia}  => {pretty}       0.04  1.0000000 25.000000


суббота, 11 мая 2013 г.

Is Apple stock price determined by the sun?


About geomagnetic effect on stock prices.

While studying the impact of different factors on stock prices, we obtained a very interesting and somewhat unexpected result of the dependence of stock prices of some companies on geomagnetic activity. We have loaded the stock prices of some companies, in particular Apple, for the time period from 2012.01.01 to 2013.03.30, and then we compared the data with the Kp index, which reflects geomagnetic activity. Geomagnetic activity is caused by solar activity.  The following figure shows the graphs of geomagnetic activity and AAPL stock prices:

The following figure shows the moving averages of the value with the averaging window of 50 days:

 It is visually obvious that the trends of the curves is similar at some time periods.  To define causal relation, we used Granger causality test. We researched the causal dependence of stock prices on geomagnetic activity (test 1) and the inverse relationship (test 2). We obtained the following results:

test 1
Model 1: AAPL ~ Lags(AAPL, 1:1) + Lags(Kp, 1:1)
Model 2: AAPL ~ Lags(AAPL, 1:1)
  Res.Df Df      F  Pr(>F)  
1    449                    
2    450 -1 9.2599 0.00248 **
---
Signif. codes:  0 ‘***’ 0.001 ‘**’ 0.01 ‘*’ 0.05 ‘.’ 0.1 ‘ ’ 1
Granger causality test

test 2

Model 1: Kp ~ Lags(Kp, 1:1) + Lags(AAPL, 1:1)
Model 2: Kp ~ Lags(Kp, 1:1)
  Res.Df Df      F Pr(>F)
1    449                
2    450 -1 0.2149 0.6432

The p-values for the test 1 is equal 0.00248, it means that geomagnetic activity affects the Apple stock prices with the probability more that 99% . It is obvious that such an effect is possible because of the geomagnetic dependence of investors' psychological mood.

We will carry on our research and the results will be published in our blog.

среда, 8 мая 2013 г.

Granger Causality Test for Frequent Itemsets of Keywords in Financial Tweets

Taking into account a well-known work (Bollen, Johan, Huina Mao, and Xiaojun Zeng. "Twitter mood predicts the stock market." Journal of Computational Science 2.1 (2011): 1-8.),  we have loaded twitter users' tweets that concern financial news. We downloaded the tweets of the following users:
"CNNMoney", "TheStreet", "FoxBusiness", "SeekingAlpha", "WallstCS", "themotleyfool", "MarketWatch", "CNBC", "ReutersBiz", "WSJ", "YahooFinance", "MicroFundy", "chartly", "MarketBeat", "ReutersTV", "BloombergTV", "profitly", "myrollingstocks", "BloombergNews", "Stockstobuy", "tradespoon", "stockr", "stocktwits", "FinancialBrand", "Option_Trading", "EconomicTimes".

The analysis was conducted for the time period of 100 days. We chose a frequent itemset  of keywords {apple, stock}. The following figure  shows the dynamics of the frequency of the frequent itemset and stock price.
 
 The graph also shows the time dynamics of moving averages with the averaging time window  of 10 and 20 days. We conducted the Granger test to determine the causation  between the time dynamics of frequent sets and the stock price. In the first test, we considered the null hypothesis about lack of causality between the dynamics of the frequent itemset {apple, stock} and AAPL stock price; in the second test, we examined the null hypothesis about lack of the causality between AAPL stock prices and the dynamics of the frequent itemset {apple, stock}. The calculations were performed using  R packages. We have got the following results:
test 1
Granger causality test
Model 1: V3 ~ Lags(V3, 1:1) + Lags(V2, 1:1)
Model 2: V3 ~ Lags(V3, 1:1)
  Res.Df Df     F   Pr(>F)  
1     87                    
2     88 -1 10.05 0.002103 **
---
Signif. codes:  0 ‘***’ 0.001 ‘**’ 0.01 ‘*’ 0.05 ‘.’ 0.1 ‘ ’ 1

test 2
Granger causality test
Model 1: V2 ~ Lags(V2, 1:1) + Lags(V3, 1:1)
Model 2: V2 ~ Lags(V2, 1:1)
  Res.Df Df      F Pr(>F)
1     87                
2     88 -1 0.3261 0.5694

p-value in the first test is equal to 0.002103, this is significantly less than the standard significance level of 0.05. P-value in the second test is equal to 0.5694, this is substantially more than the standard significance level of 0.05. It means that the dynamics of the frequent itemsets of keywords {apple, stock} in users' tweets under analysis determines the dynamics of Apple stock prices.
 
Taking into consideration the causality found between the frequent sets of keywords and stock price,
one can predict stock prices using multivariate vector autoregressive model. On the following figure, we showed  the forecasting for AAPL which is based on the VAR model  using both hystorical Apple stock dynamics and the dynamics of frequent itemsets of keywords {apple, stock}.


Our program Tweets Miner for Stock Market is described in our previous blog
http://bpavlyshenko.blogspot.com/2013/05/tweets-miner-for-stock-markets.html

вторник, 7 мая 2013 г.

Tweets Miner for Stock Markets

Comparing  stock market charts with frequent sets of keywords in Twitter microblogs messages.


Download Tweet Miner (twm.zip)


I would like to present an R code for the analysis of tweets from a specified list of twitter users,
such as: CNN, WSJ, Reuters, Bloomberg, etc.

To form frequent sets of keywords for the analysis, you should compose a list of some specific frequent terms, and using this list, you can find the terms which are associated with these frequent terms. E.g. a term "apple" is associated with "aapl", "ipad", "iphone". Then  the following frequent sets can be investigated: "apple", "apple aapl", "apple aapl ipad",  etc.
 
To work with this program, you need to install R (more info at http://r-project.org). You can start the program twm.r via file menu of R GUI, or simply drag and drop twm.r  to R Console of R GUI.
Before starting the program twm.r, you need to install some additional packages, you can do this by running the installation.r program. All messages, including frequent terms and the lists of  associations, appear on R Console. 

 Before the analysis, one should click on the buttons "Load new users' tweets" and "Load financial time series". Keep in mind that Twitter API does not allow to load a large number of tweets. So, if an error message from Twitter API appears, you need to wait several hours and then click again on the buttons "Load new users' tweets", the loading of new tweets will continue. Each time the latest tweets only will be loaded, previous tweets are saved in the file and can be used for the next analysis. So, when you load new tweets periodically, every day, then you will have no problems with exceeding the numbers of requests to Twitter API. To avoid such problems, you can decrease the value of max number of tweets which can be loaded for each user. This option can be set up in the file inc/config.r.
The analysis can also be performed without loading new tweets and financial time series. In this case the analysis will be carried out for previously loaded tweets and financial time series which are saved in the data files. For plotting a chart with candles and volumes, you should have Internet connection. To start new tweets database for the analysis, simply delete data files in the dir 'loaded_feeds'.

When you try to find frequent terms or associations for the first time per session or after loading new tweets, the program requires several minutes for documents-terms matrix creation. It happens only once per session.

To plot time dynamics of frequent sets of keywords, you need to specify a frequent set in the lower case, e.g. "apple", "apple aapl", "apple iphone", etc.; then choose a Stock symbol for comparing time series and choose the time windows for two moving averages, then click on the button "Plot Dynamics of Frequent Sets". The time dynamics of frequent sets of keywords includs two moving averages which can be used for trading strategy with the intersection of two moving averages.
 
The program also plots a crosscorrelation function which shows how  moving averages (with a time window specified in option "moving average 1") of frequent sets and stock price correlate. It allows to find predictive frequent sets.

Our next step is going to be the use of multivariate forecasting algorithms, based on the vector ARMA model. These algorithms  can include many time series into analyses, the time series describe both stock prices and quantitative characteristics of tweets. I think such an approach will give the narrower  and more precise forecasting. We are also planning to use the theory of semantic fields, frequent sets, association rules, Galois lattice, and the formal concepts analysis. Such an approach can be found in our previous investigations at
http://arxiv.org/ftp/arxiv/papers/1302/1302.2131.pdf
http://bpavlyshenko.blogspot.com/2012/12/the-model-of-semantic-concepts-lattice.html

Some printscreens:

GUI of Tweets Miner:


The time dynamics of the frequent set "apple stock" for trading strategy with the intersection of two moving averages:
 
 Frequent Terms:
 
 
 Associations with the term "market":
 

Crosscorrelation the frequent set "apple stock" with stock AAPL
 
The chart with candles, volumes of stock and moving averages of keywords frequent sets:


ARIMA forecasting:


Best regards,
Bohdan Pavlyshenko